Microsoft vs. Google: The New Battle for Your Network
If Microsoft (NASDAQ: MSFT) had optimized expenses in the quarter ended June 30, 2007 the company would have earned $6.3 billion. Its actual earnings were $4.0 billion. Management threw $2.3 billion down the drain by over spending on everything in its competition with Google (NYSE: GOOG). In their book Blue Ocean Strategy, Professors Kim and Mauborgne of INSEAD don't tell us what Microsoft might do for a second act. That's because Microsoft may have been born in a blue ocean, but now the company is living in a red one.
According to the latest Interbrand report published in Business Week, Microsoft is the second most valuable brand on the planet. Google, incorporated in 1998, is number 20 on the list. Both of these companies were born in a "blue ocean" of their own creation. But today Microsoft, at 32 years old, already is long in the tooth for an IT company. Management now must survive in a sea of "Red Ocean" expenses. Hounded on all sides by Google as well as newer upstarts. However appealing blue oceans may be, nearly every company ends up in a sea of red ocean expenses. At that point the most compelling question is how to manage expenses in this environment. Theoretically, the best way to do that is to "optimize" these costs. This is the 8th in my series of posts on corporate brands in enterprise marketing.
The Old Battle For Your Desktop
IBM (NYSE: IBM), founded in 1898 as the Tabulating Machine Company, today is the third most valuable brand in the world. This makes it easy to forget that the company drifted into a sea of "red ocean" expenses by the early 1990s.
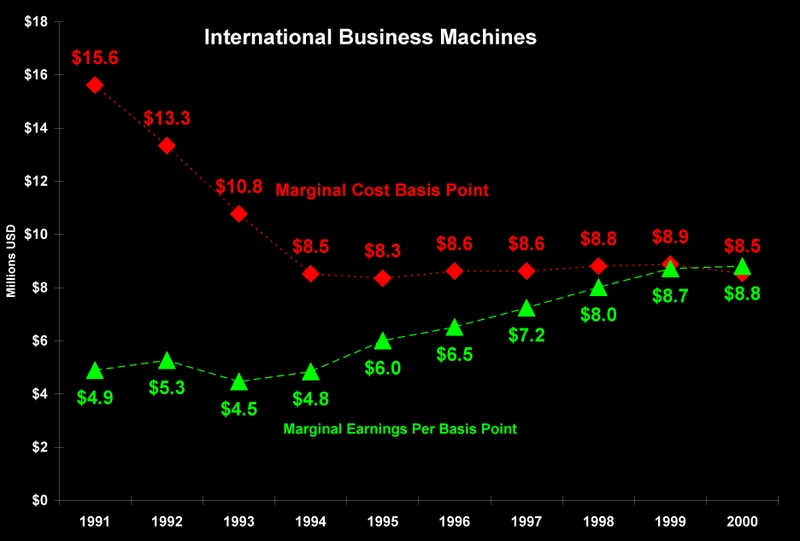
IBM dominated the world market in computers. Its sales revenues in 1991 were $64.8 billion. In that year IBM captured 76.6% of combined revenues in a strategic group with Hewlett Packard (NYSE: HPQ), Dell (NYSE: DELL) and Compaq Computer. At that time the company had a huge "red ocean" spending problem amounting to about $7 billion. Just when the company was about to be spun off into five or six independent parts Lou Gerstner came to the rescue. Under his leadership IBM's sales increased to $88.4 billion in 2000. But its share of revenues in the same group fell dramatically to 41.9%.
How did Mr. Gerstner solve the problem? He and his management team increased the marginal earnings delivered by each 1/100th of a market share point and decreased its marginal cost until the two were almost exactly equal. This chart tells the story.
How did they do that? You can read the details in Chapter 6 of my book Competing for Customers and Capital -- "The Battle for Your Desktop."
The New Battle For Your Network
Microsoft and Google are the leading players in the new battle for your network. This table show how they stood as of June 30, 2007. With sales of $13,371 million Microsoft dominated the market, capturing 77.5% of the combined revenues.

Microsoft's total costs were $9,382 million compared with Google's $2,767 millon. A closer look at these numbers, standardized as the cost per dollar of revenue, reveals an important problem: the two companies apparently applied very different financial accounting rules to their income statements.
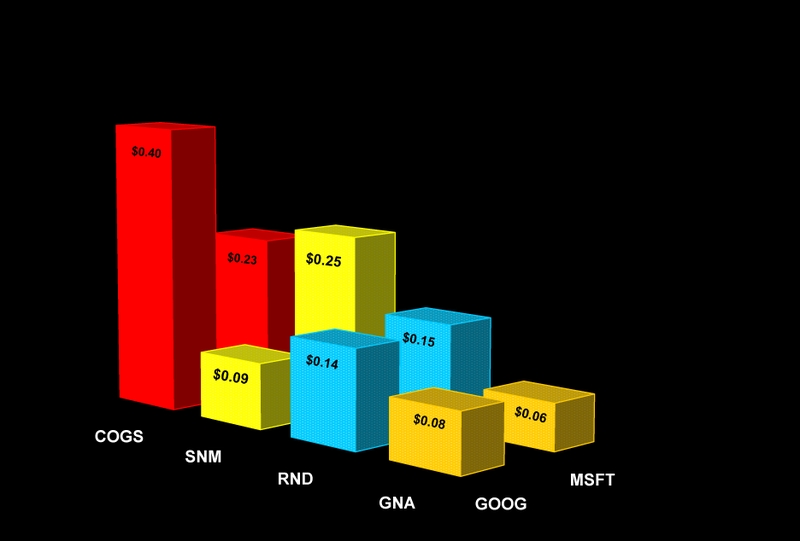
Google reported its cost of goods and services [COGS] was $0.40 per dollar sales, while Microsoft reported it was just $0.23 per dollar sales. Meanwhile GOOG reported sales and marketing [SNM] expenses as $0.09 per dollar, while MSFT reported they were $0.23 per dollar. Looks like their financial accountants have very different definitions of these two costs. Unexplained differences like these can play havoc with optimizations. Yet, research and development [RND] costs per dollar as well as general and administrative [GNA] costs per dollar were about the same. The only way to resolve these differences, without access to their books, is to add up all the expenses and run the optimization on each company's "Total Costs."
Microsoft Threw $2.3 Billion Down the Drain
A simple static analysis will serve as a first take on Microsoft's performance. The horizontal axis of this chart is Microsoft's share of combined revenues. The vertical axis is the company's marginal earnings (green schedule) and marginal costs (red schedule) per share point. The company actually captured 77.5% of combined revenues in the quarter ended June 30, 2007.

Sometimes it's great to be the market leader. But in this case it's not. Microsoft shelled out $539 million for that 77th share point. And it was worth only $172 million after total costs. Not a good thing. To maximize earnings (by optimizing total costs) the company should have captured only 60.3% of the market. That's the point where the marginal cost and earnings per share point were exactly equal.
But, wait a minute. Microsoft management would never give up revenue to "optimize" costs. Exactly so. They wouldn't "give up revenue." But, like Lou Gerstner, Bill Gates may be forced by customers to watch their major "blue ocean" competitor add billions to revenues that remain beyond his reach. With the result of a sinking share of future revenues.
This chart shows the theoretical impact on earnings of optimizing Microsoft's total "red ocean" costs of competing with Google in 2007. The horizontal axis is share of revenues. The vertical axis is earnings before interest, taxes, depreciation and amortization.
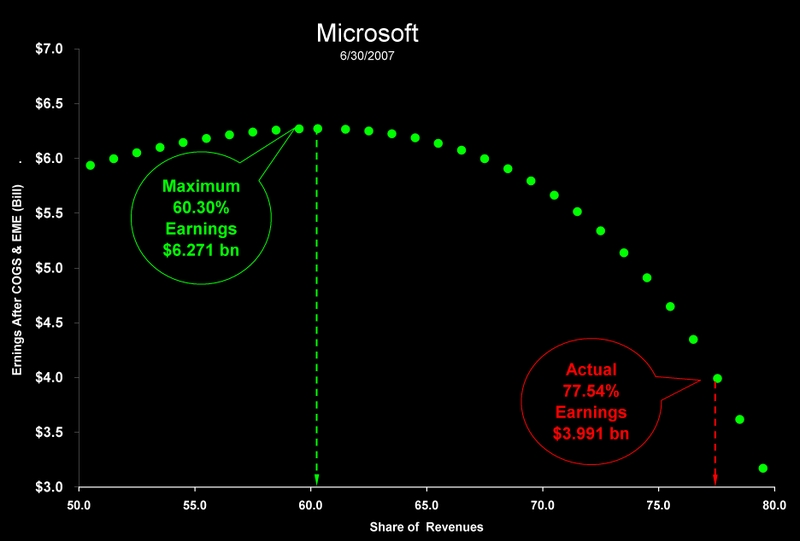
Microsoft's earnings were $3.991 billion at its actual revenue share of 77.5%. At the optimum level of competitive spending Microsoft's revenue share should be 60.3%, generating earnings of $6.271 billion. The difference is the $2.3 billion in theoretical earnings that management threw down the drain in the 2nd quarter of 2007.
Is Microsoft the IBM of the 21st Century
We probably won't know the answer to this question for several years, if not for a decade. But the parallels are there. A brash young upstart (Google is Microsoft's Dell to IBM) steps in with a game changing "Blue Ocean" strategy. At first Google was not considered a threat. When the upstart became just that Steve Ballmer, Microsoft's CEO, called Google a "one trick pony". Sticks and stones! Is it likely that Microsoft can change its underlying "desktop" business model to compete with Google for dominance of your network? What do you think?

Blogged with Flock
4 comments:
What a nice article !!
I am surprised to see his knowledge about BOS.
Thank you buddy for this cool article.
Thanks for publishing up my article on your blog. It's important for me to reach your readers because I greatly admire the insights found in Blue Ocean Strategy.
Kim and Mauborgne say numbers don't matter in a blue ocean (this may be a bit of an overstatement, since every strategy canvas depends on interval scaled numbers bounded by High and Low). But, numbers matter a LOT more if you're operating in a red ocean! Kim and Mauborgne' book provides an excellent canvas on which to paint my case for optimizing red ocean expenses.
Vic
p.s. You published my article before I found and corrected the following three errors:
The first appears in the section on "The New Battle for Your Network" between the table and the chart: Google's $2,767 billion should be Google's $2,767 million.
Second, I misspelled Ballmer's name as Ballomer.
Third, I used the wrong hyperlink to his "one trick pony" comment. The correct link is http://cbs5.com/business/local_story_074175502.html
Please correct these errors when you have a chance.
Thanks again
oh, . Because I have been at the site of my project, I've just see your comment. I will correct those three errors you mentioned. thank you Vic.
Great website, looks very clean and organized. Keep up the good work!
Post a Comment